Update Date: November - 2022
In the previous section (Part 1) we observed that the rise in disability rates post 2/2021 is stronger in individuals who are in the employed and in the labor force than the general population. Being employed was not favourable in terms of health outcomes from 5/2021. We think that the vaccination mandates may have played a role; as individuals in some sectors of the job market had no choice but to be vaccinated in order to find work or stay at work.
In this section we expand on this question and deepen the analysis of the changes in disabilities from 2/2021. For that purpose we consider different metrics that help us understand what is going on. The figure below provides a schema that clarifies the problem at hand.
The schema shows the disabled and non-disabled populations for two different time periods (2/2021 and 11/2022 in our example). This is valid for each population cohort (population, civilian labor force, employed, etc) and different age groups. The difficulty in examining the problem is that from period 1 to period 2, while there might be an increase/decrease in disabilities (from A' to B') but there might also be an increase/decrease in the non-disabled population (for instance when considering the cohort "not in the labor force"), for instance due to changes in economic circumstances. Consequently, measuring the disability rate in both periods, might not provide us an accurate measure for the changes in disabilities. To tackle this problem we compute and analyse different metrics:
- Change in disabilities, (B'-A').
This represents the total rise in the number of disabilities for a given cohort and age group.
- Disability rate, r1=A'/(A+A') and r2=B'/(B+B').
This represents the disability rate at the different time periods.
- Change in the disability rate, (r2-r1).
The change in disability rate attempts to capture the absolute change in disabilities in a given cohort, adjusted for the population size. This is valid for the whole population cohort as an individual has to belong to this cohort by definition. However, when measuring the change in disability rate in the Civilian Labor Force cohort, we must consider the possibility of changes in the disability rate being due to changes in individuals originating from the "not in the labor force" cohort. This might mean, for example, that a rise in the disability rate might be attributed to more disabled individuals actively searching for work, instead of being out of the workforce.
- Rate of change in the disability rate, (r2/r1-1).
The rate of change in disability rate attempts to capture the relative change in disabilities in a given cohort, adjusted for the population size. This is valid for the whole population cohort as an individual has to belong to this cohort by definition.
When measuring the rate of change in disability rate in the Civilian Labor Force cohort, we must consider the possibility of changes in the disability rate being due to changes in individuals originating from the "not in the labor force" cohort. This might mean, for example, that a rise in the disability rate might be attributed to more disabled individuals actively searching for work, instead of being out of the workforce.
- Rate of new disabilities, (B'-A')/A.
This tries to measure the change in disabilities in a given cohort relative to the previous non-disabled individuals. We believe this measure provides a better approximation to the rate of change in disabilities in a given cohort. However, it still does not solve the problem of individuals (disabled or not) that are "not in the labor force" at the start date, jumping to the Civilian Labor Force in the end date, or vice versa.
This section investigates the changes in disabilities in the different population cohorts, namely, the whole population, of which some are in the civilian labor force and others are out, and the employed.
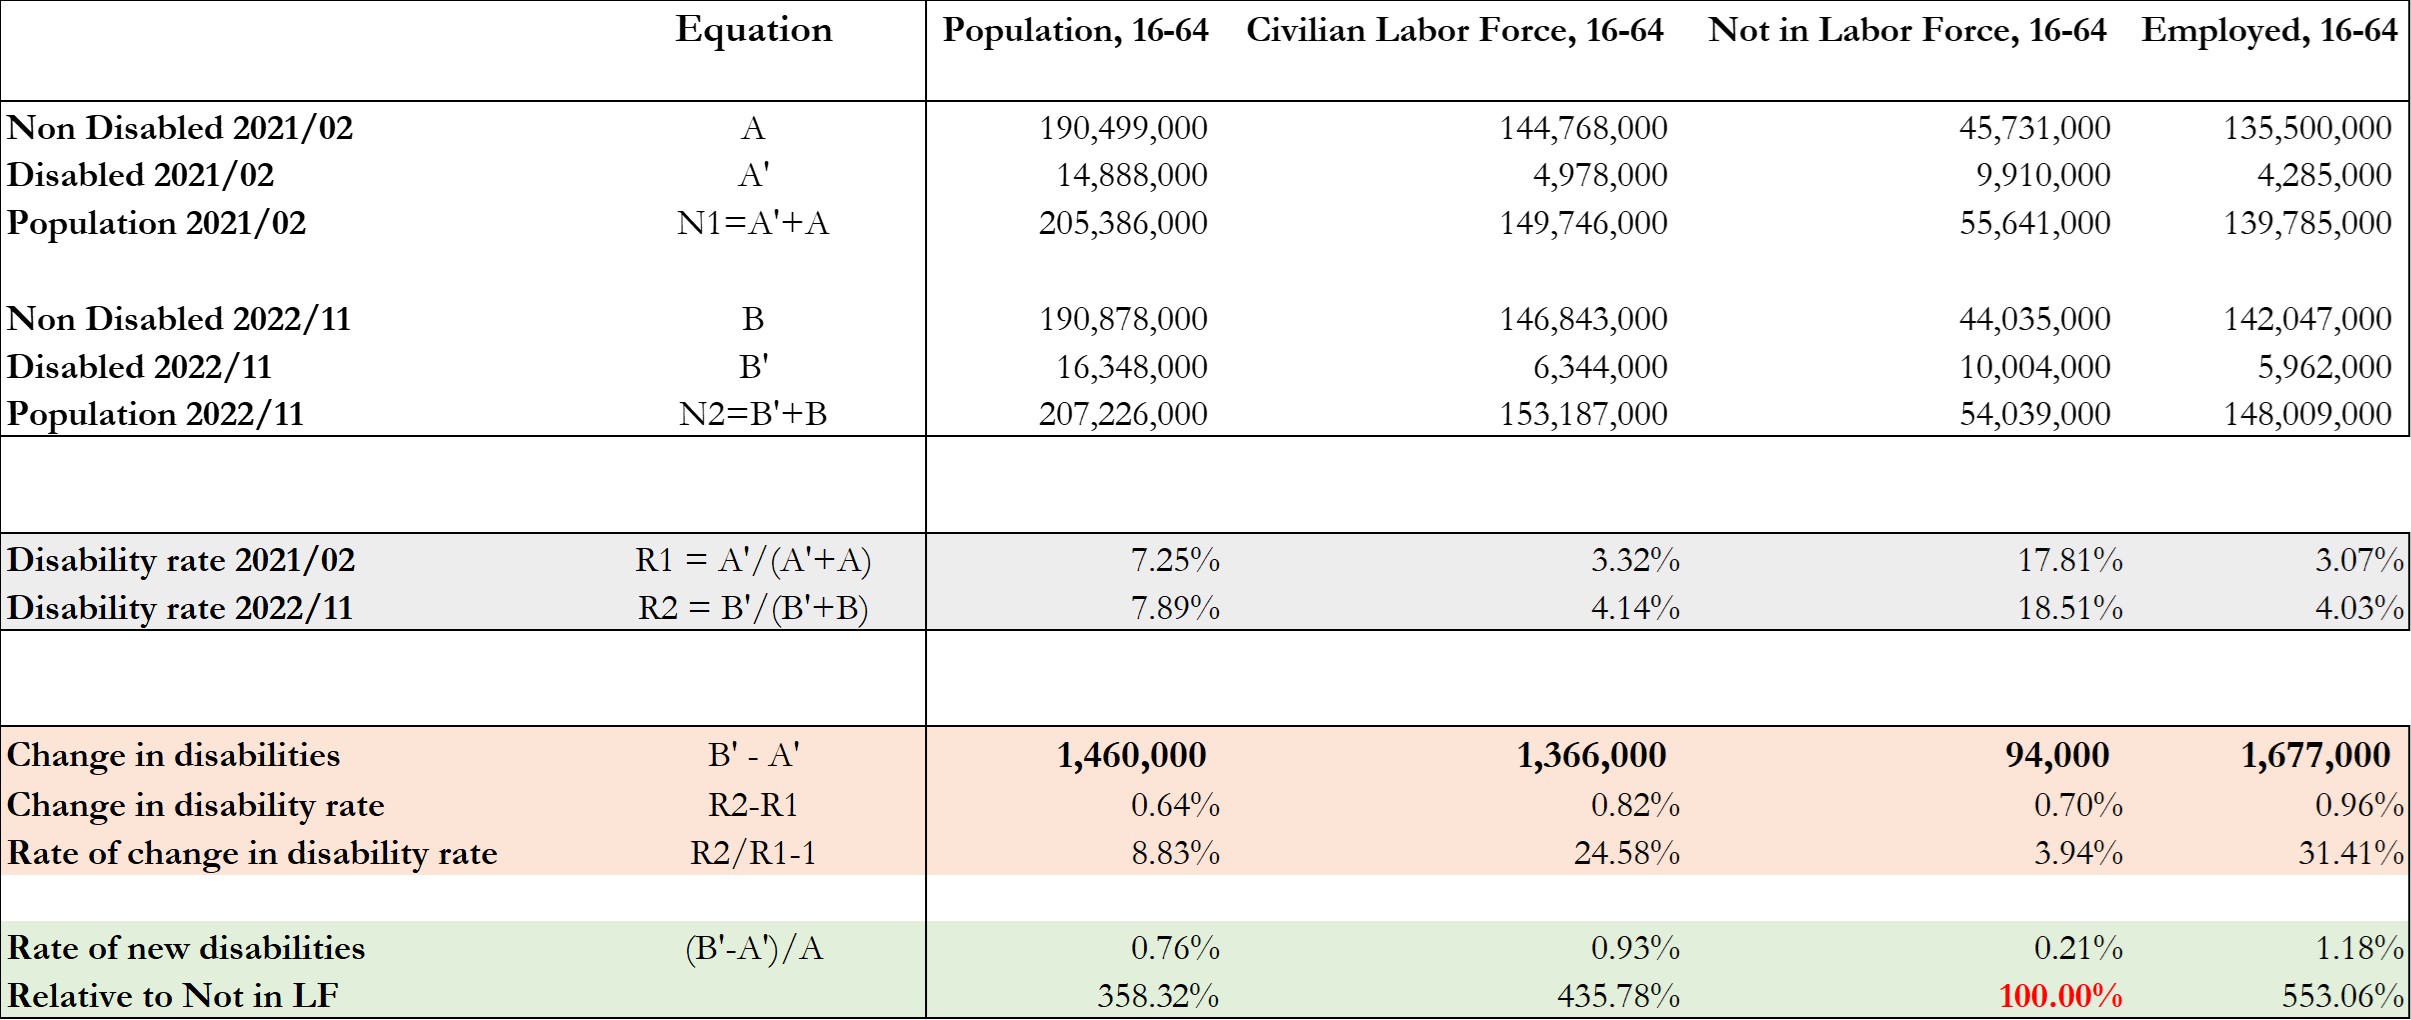
The following table provides a summary of different statistics that measure different aspects of the nature of the changes in disabilities that occurred from 2/2021 to 11/2022. The table condenses a lot of information which we will explain below.

Rise in disabilities: Absolute numbers.
Relative rise in disabilities.
In relative terms, we can observe that increase in the disability rate was 0.64% for whole population which corresponded to a 8.8% rise. For the Civilian Labor Force the rise in the disability rate was to 0.82%, corresponding to a 24.6% rise for the period.
We observe that the overall population suffered a lower relative rise in the disability rate (8.8%) when compared to the Civilian Labor Force (24.6%), which seems to suggest that perhaps the vaccine mandates for employment contributed to the higher relative rise in disability rates. However, as previously mentioned we must be cautious before making that statement as the whole population had a much higher base disability rate (7.25%) when compared to the Civilian Labor Force (3.3%).
A preferable method measure to compare the rise in disabilities in the whole population vis-à-vis the Civilian Labor Force is to use the rate of new disabilities. For the whole population we can observe that the rate of new disabilities for the 2/2021 to 11/2022 period was 0.76% while for the Civilian Labor Force it was 0.93% (which is a 22.3% higher rate).
Perhaps the best way to have an idea if being in the workforce, and therefore subject to the vaccine mandates for employment, was detrimental to one's health compared to opting to be "not in the workforce" (with the choice of taking the vaccine or not) is by comparing the rate of new disabilities in these two cohorts. For individuals in the Workforce, the rate of new disabilities was 0.93% for the period, while for those not in the workforce it was 0.21% (which is a 4.4x lower rate).
These results add support to the hypothesis that having "choice" in taking the inoculation was beneficial to one's health during the rollout period.
This section investigates the changes in disabilities, for the 65+ age group, in the different population cohorts, namely, the whole population, of whom some are in the Civilian Labor Force and others are out, and the employed.
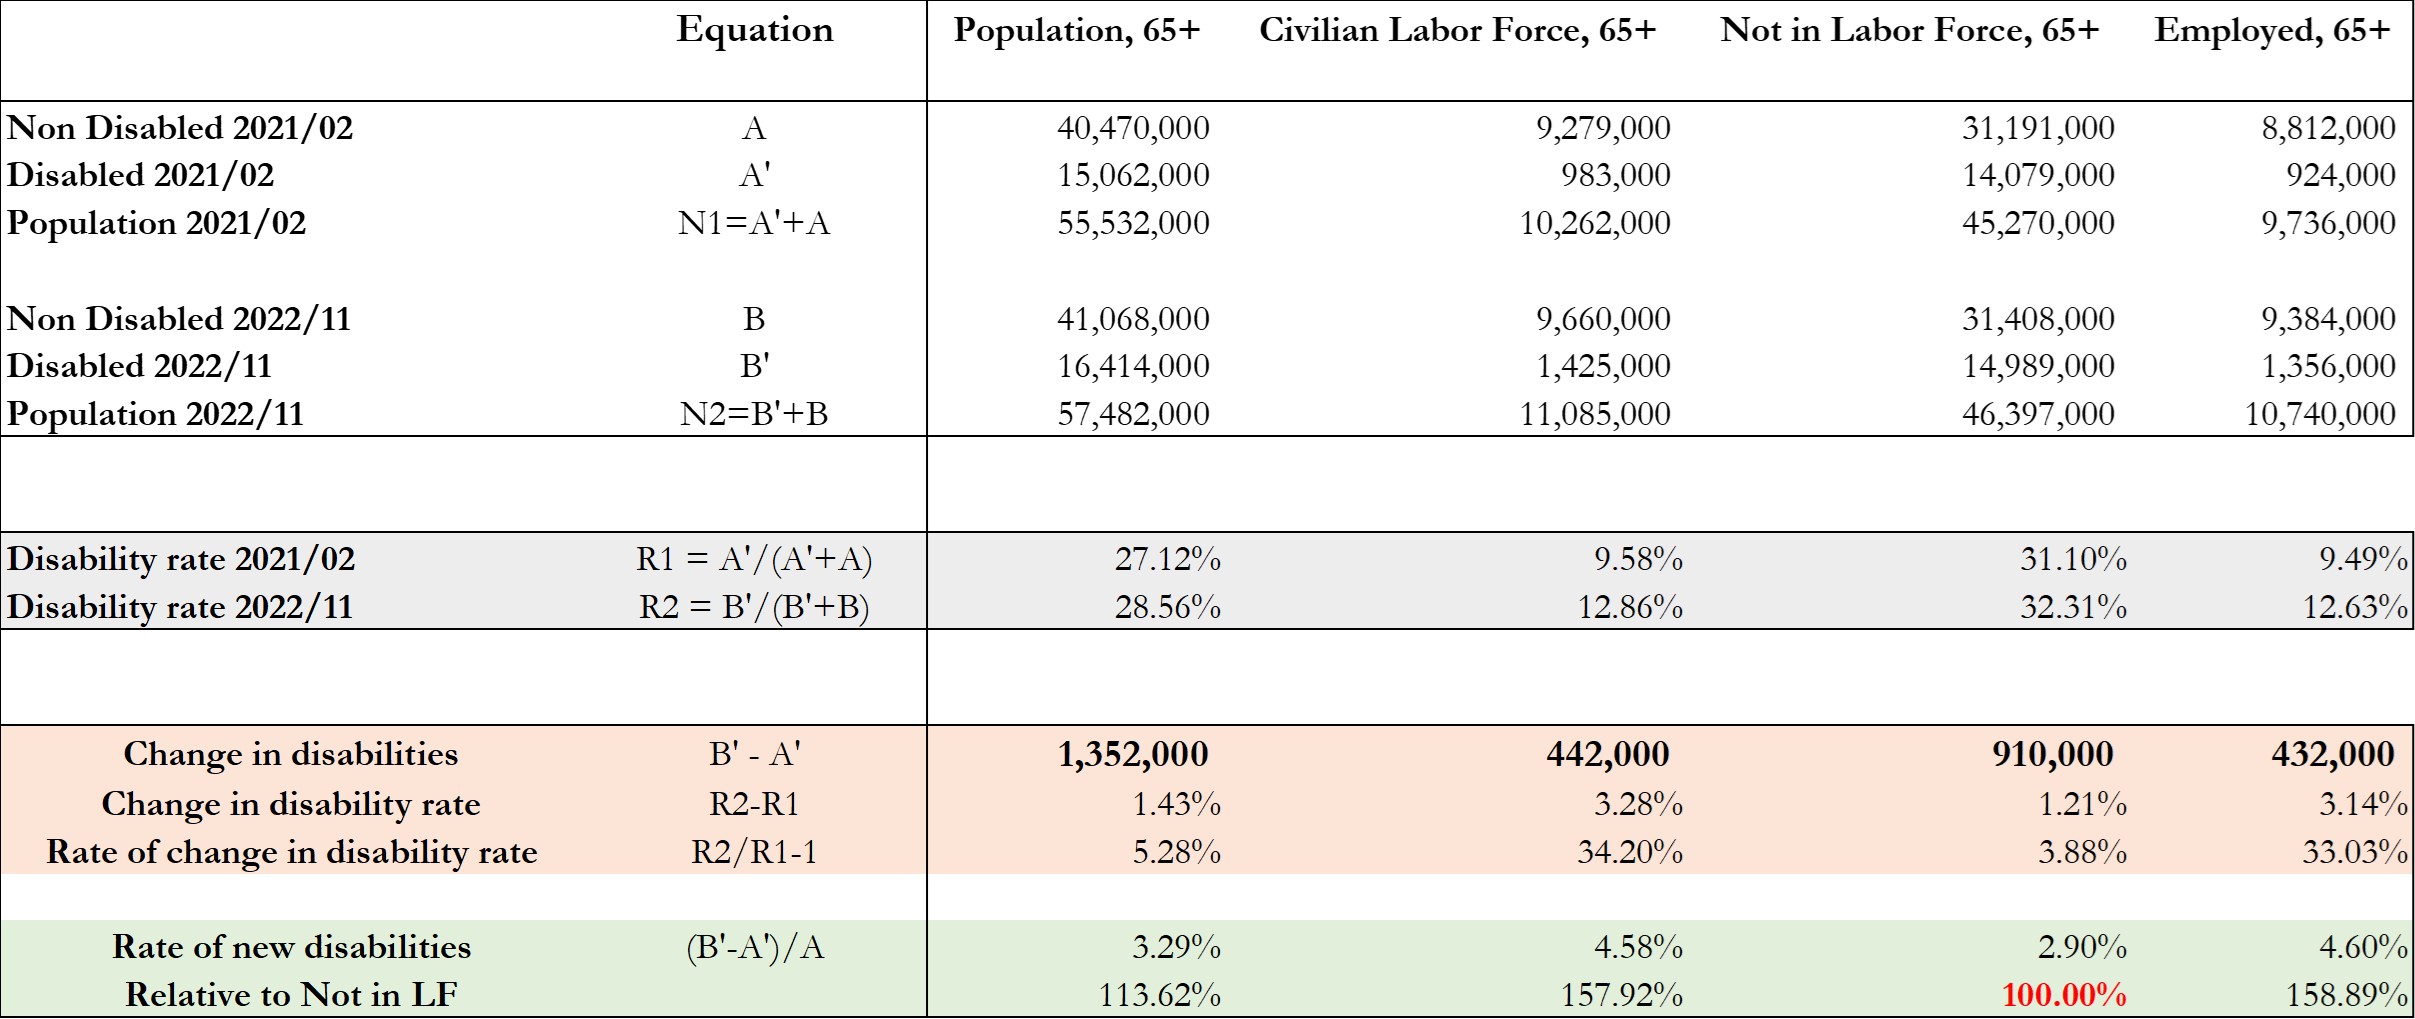
The following table provides a summary of different statistics that measure different aspects of the nature of the changes in disabilities that occurred from 2/2021 to 11/2022. The table condenses a lot of information which we will explain below.

Rise in disabilities: Absolute numbers.
Relative rise in disabilities.
In relative terms, we can observe that increase in the disability rate was 1.43% for whole population which corresponded to a 5.28% rise. For the Civilian Labor Force the rise in the disability rate was to 3.28%, corresponding to a 34.2% rise for the period.
We observe that the overall population suffered a lower relative rise in the disability rate (5.28%) when compared to the Civilian Labor Force (34.2%), which seems to suggest that perhaps the vaccine mandates for employment contributed to the higher relative rise in disability rates. However, as previously mentioned we must be cautious before making that statement as, for the 65+ age group, the whole population had a much higher base disability rate (27.12%) when compared to the Civilian Labor Force (9.58%).
As mentioned previously, a preferable method measure to compare the rise in disabilities in the whole population vis-à-vis the Civilian Labor Force is to use the rate of new disabilities. For the whole population we can observe that the rate of new disabilities for the 2/2021 to 11/2022 period was 3.29% while for the Civilian Labor Force it was 4.58% (which is a 39.2% higher rate).
Perhaps the best way to have an idea if being in the workforce, and therefore subject to the vaccine mandates for employment, was detrimental to one's health compared to opting to be "not in the workforce" (with the choice of taking the vaccine or not) is by comparing the rate of new disabilities in these two cohorts. For individuals in the "Not in the Workforce", the rate of new disabilities was 2.90% for the period, while for those in the Workforce it was 4.58% (which is a 57.9% higher rate).
These results add support to the hypothesis that having "choice" in taking the inoculation was beneficial to one's health during the rollout period.
Comparing the rise in disabilities in younger (16-64) and older (65+) individuals.
For the period of 2/2021 to 11/2022 we observed a total rise in disabilities of 2.812 million for the whole population of which 1.460 million in the 16-64 age group and 1.352 million in the 65+ age group. We should note that the base level for the population aged 16-64 was 205.386 million while only 55.532 million for the 65+ age group.
In relative terms, the rise in the disability rate in the 16-64 population was 0.64% (corresponding to a 8.83% rise) while for the 65+ population it was 1.43% (corresponding to a 5.28% rise).
The rate of new disabilities in the 16-64 population was 0.76% while in the 65+ population it was 3.29% (which is 4.3x higher than the younger population). These numbers suggest that the impact of the inoculations is being felt more in the older population than in the younger age groups. This is not talked about at the moment, as most attention is focused on disabilities and deaths in younger individuals.
For the Civilian Labor Force we observed a total rise in disabilities of 1.808 million of which 1.366 million are in the 16-64 age group and 0.442 million in the 65+ age group. We should note that the base level for the population aged 16-64 was 149.746 million while only 10.262 million for the 65+ age group.
In relative terms, the rise in the disability rate in the 16-64 Civilian Labor Force was 0.82% (corresponding to a 24.58% rise) while for the 65+ age group it was 3.28% (corresponding to a 34.20% rise).
The rate of new disabilities in the 16-64 Civilian Labor Force was 0.93% while in the 65+ population it was 4.58% (which is 4.9x higher than the younger age group). These numbers suggest that the impact of the inoculations are being felt more in the older age group than in the younger age group. This is not talked about at the moment, as most attention is focused on disabilities and deaths in younger individuals.
Conclusions
